
Truro Real Estate Market Report 2025
Truro Real Estate Market Report 2025: A Year of Steady Growth and Seasonal Strength
By Rob Lough, Broker/Owner at Century 21 Optimum Realty
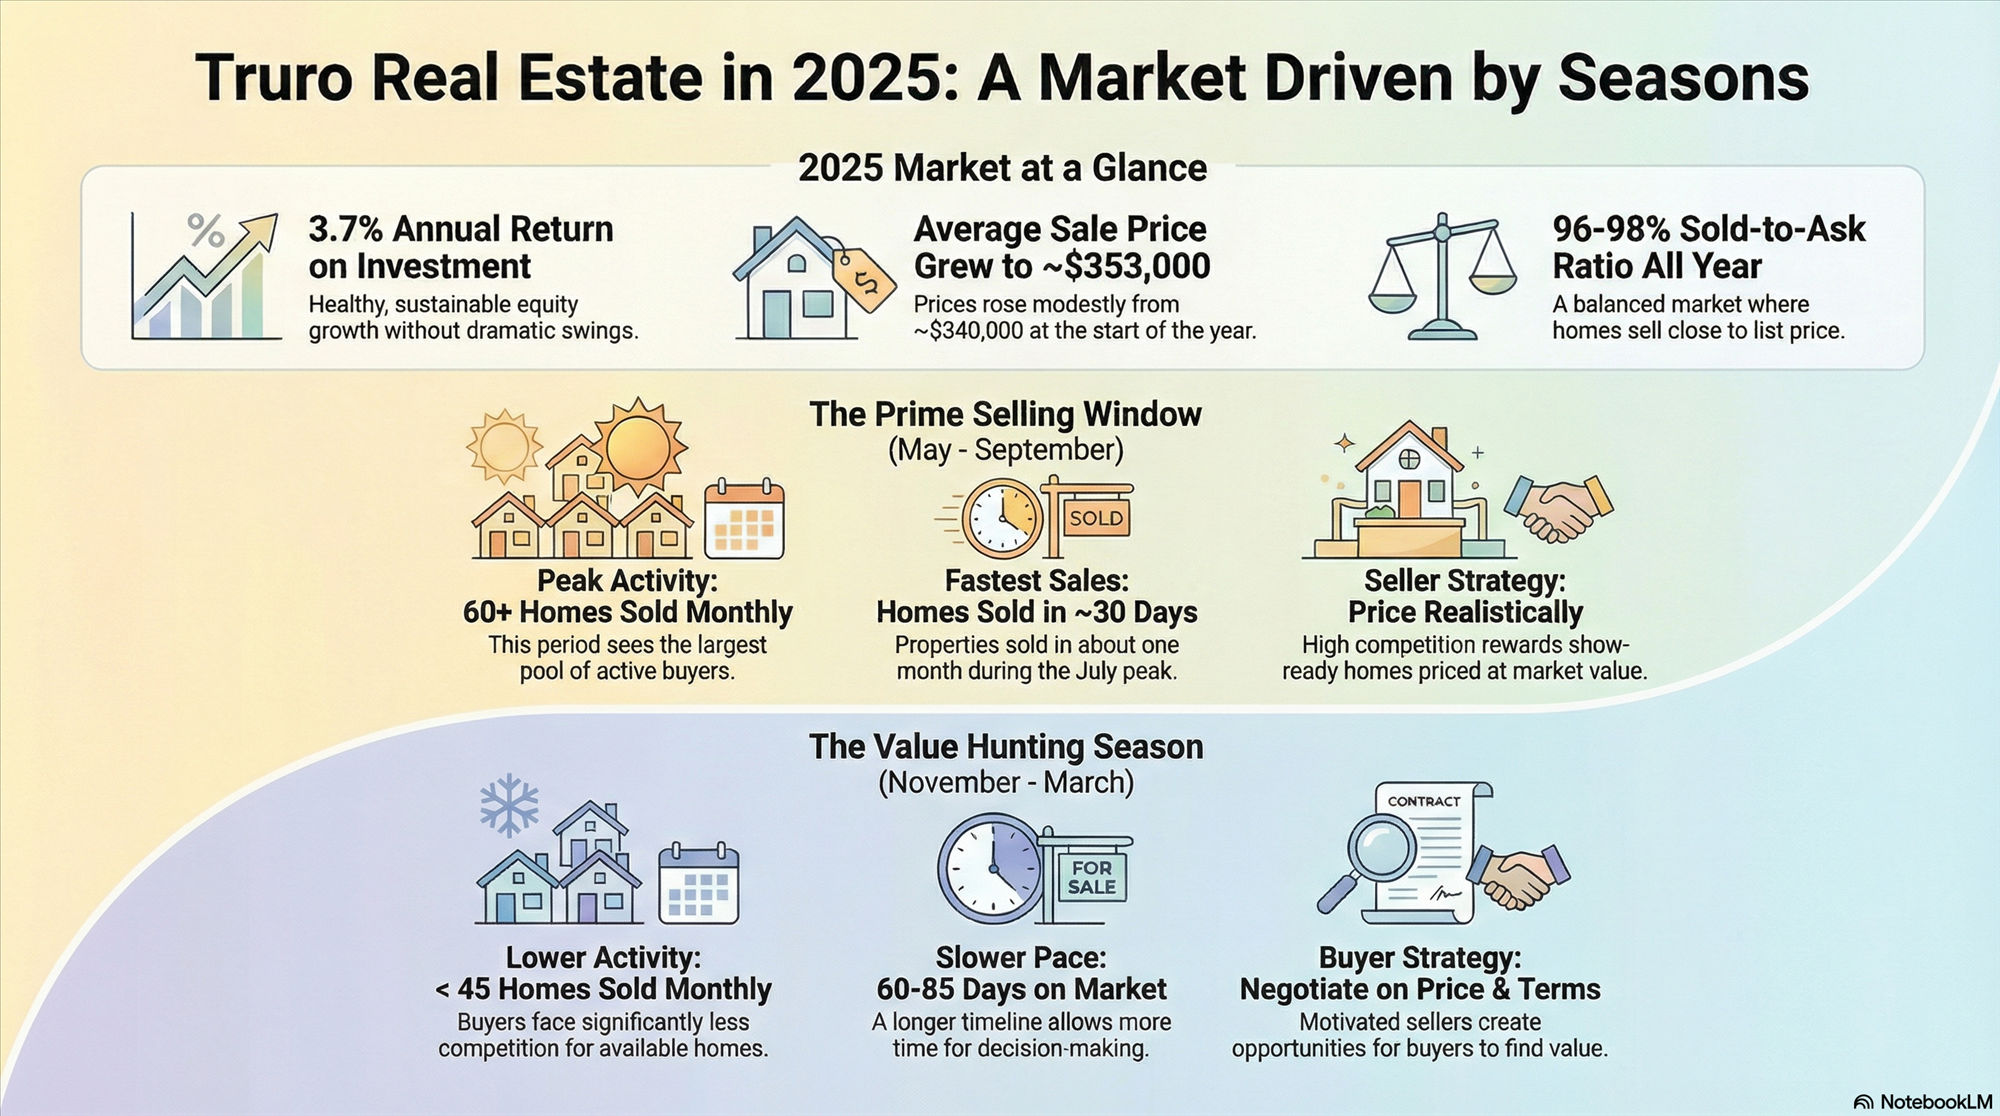
The Truro, Bible Hill, and Stewiacke area (District 104) wrapped up 2025 with a compelling story of stability and modest appreciation. While larger Nova Scotia markets experienced volatility, this central corridor maintained its reputation as a balanced, accessible market with predictable seasonal patterns and solid fundamentals.
With an annual return on investment of approximately 3.7%, District 104 offered homeowners steady equity growth without the boom-and-bust swings seen elsewhere. For buyers and sellers navigating 2026, understanding these 2025 trends is essential for making informed decisions in one of Nova Scotia's most reliable real estate markets.
Market Overview: Balanced Growth in District 104
District 104 proved itself as a stable investment market throughout 2025. The year began with average sale prices in the low $340,000s and concluded in the mid-$350,000s, reflecting gradual appreciation rather than dramatic swings. This consistent growth pattern makes the Truro area particularly attractive for first-time buyers, downsizers, and investors seeking predictable returns.
The market demonstrated classic Nova Scotia seasonality, with transaction volume climbing steadily from winter's quiet months through a robust spring and summer, peaking in early fall before tapering off as the holidays approached. This predictable rhythm allows both buyers and sellers to plan their moves strategically.
Compared to Halifax's sometimes frenzied pace, the Truro market offers a more measured environment where properly priced homes attract serious buyers without the extreme competition or lowball offers that can characterize overheated markets.
Average Sale Prices: Mild Volatility with Upward Momentum
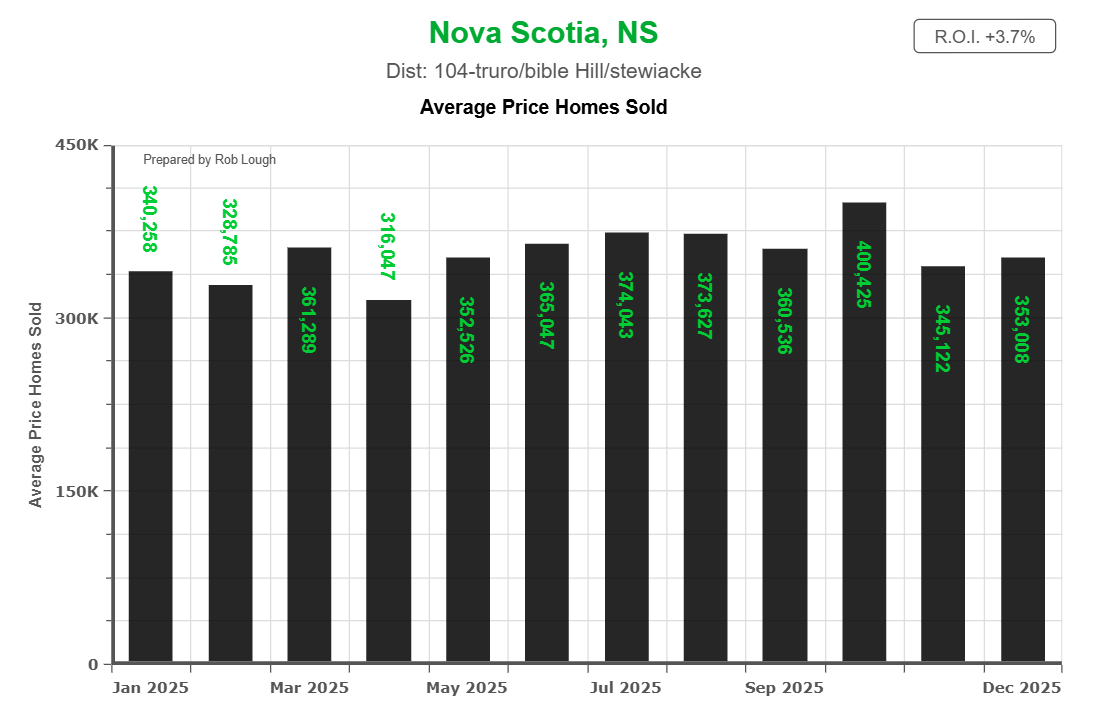
The pricing story for 2025 reveals a market that stayed remarkably centered around the mid-$300,000s for most of the year. January opened at approximately $340,256, and by December, the average had settled near $353,008—a modest year-over-year gain that reflects healthy, sustainable growth.
The year wasn't without its variations. April saw prices dip to around $316,047, likely reflecting a mix of entry-level inventory hitting the market as spring began. By contrast, October delivered the year's peak at approximately $400,426, driven by strong fall demand for move-in-ready homes before winter.
For Sellers: This pricing pattern suggests that timing your listing can impact your final sale price. The late summer through early fall window consistently delivered premium pricing, with buyers willing to pay near list for quality properties.
For Buyers: If maximum affordability is your priority, the late winter and early spring months historically present opportunities to negotiate on price, particularly on homes that have lingered through the slower winter market.
The 3.7% annual ROI demonstrates that District 104 remains an appreciating market without the overheating that can lead to corrections. This steady appreciation makes it an attractive option for both owner-occupants building equity and investors seeking reliable rental income markets.
Transaction Volume: Spring Surge, Fall Peak
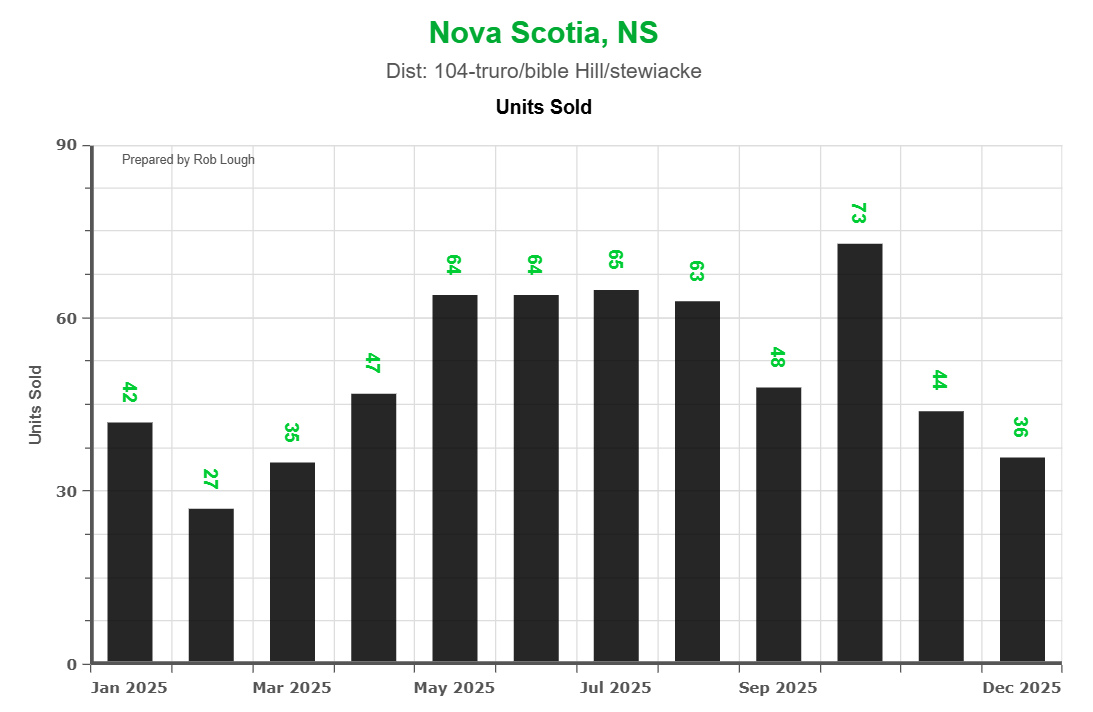
Sales activity in 2025 followed the textbook seasonal pattern Nova Scotia real estate professionals have come to expect. January saw just 42 homes change hands, climbing to 64 by May as the spring market gained momentum. The peak came in October with 73 transactions before dropping back to 36 in December.
This seasonal rhythm isn't just about weather—it reflects broader life patterns. Families prefer to move during the summer break, snowbirds return to hunt for properties in the spring, and many buyers and sellers simply pause their plans during the holiday season.
The mid-year surge from May through September, when monthly sales consistently stayed in the 60s, represents the market's sweet spot. During these months, inventory turns quickly, multiple offers become more common, and sellers enjoy the strongest negotiating position.
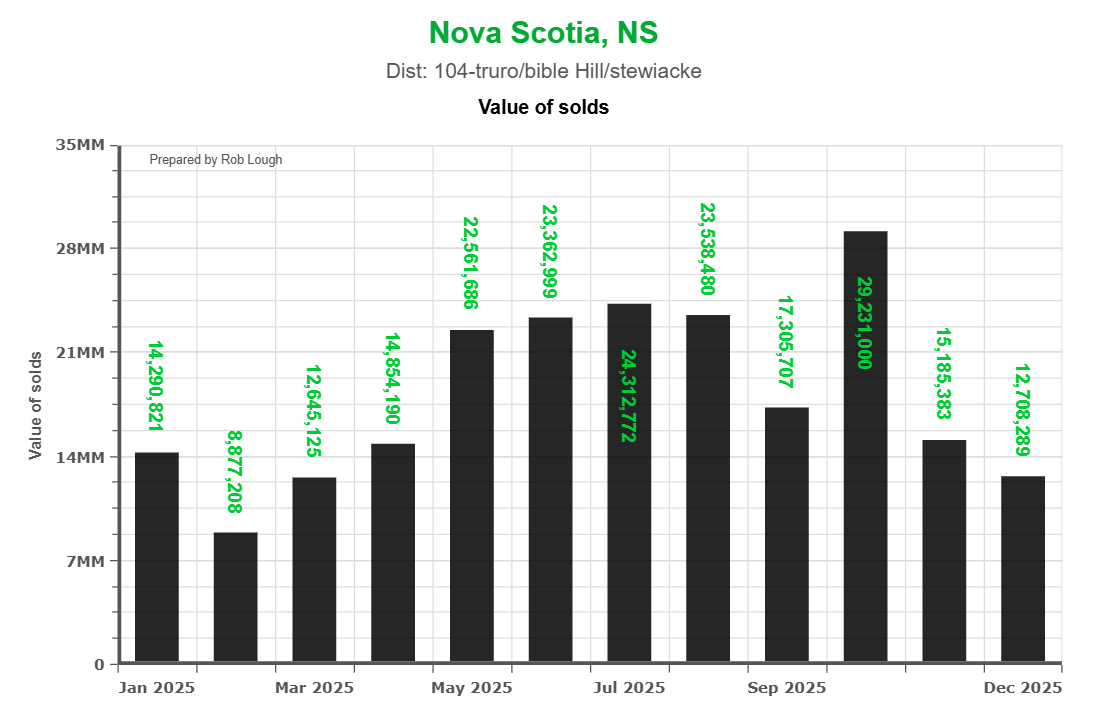
The total value of sales mirrored this pattern, climbing from approximately $14.3 million in January to nearly $29.2 million in October before settling back to around $12.7 million by year-end. These dollar volumes reflect both the number of transactions and the premium pricing that stronger demand generates.
For Sellers: If you have flexibility in your timeline, listing between May and September maximizes your exposure to the largest buyer pool. Homes that debut in early May capture pent-up demand from buyers who've been searching through the quiet spring months.
For Buyers: The slower winter months offer a different kind of opportunity—less competition, more negotiating leverage, and sellers who may be more motivated to close deals before spring brings fresh competition to their doorstep.
Days on Market: Summer Speed, Winter Patience
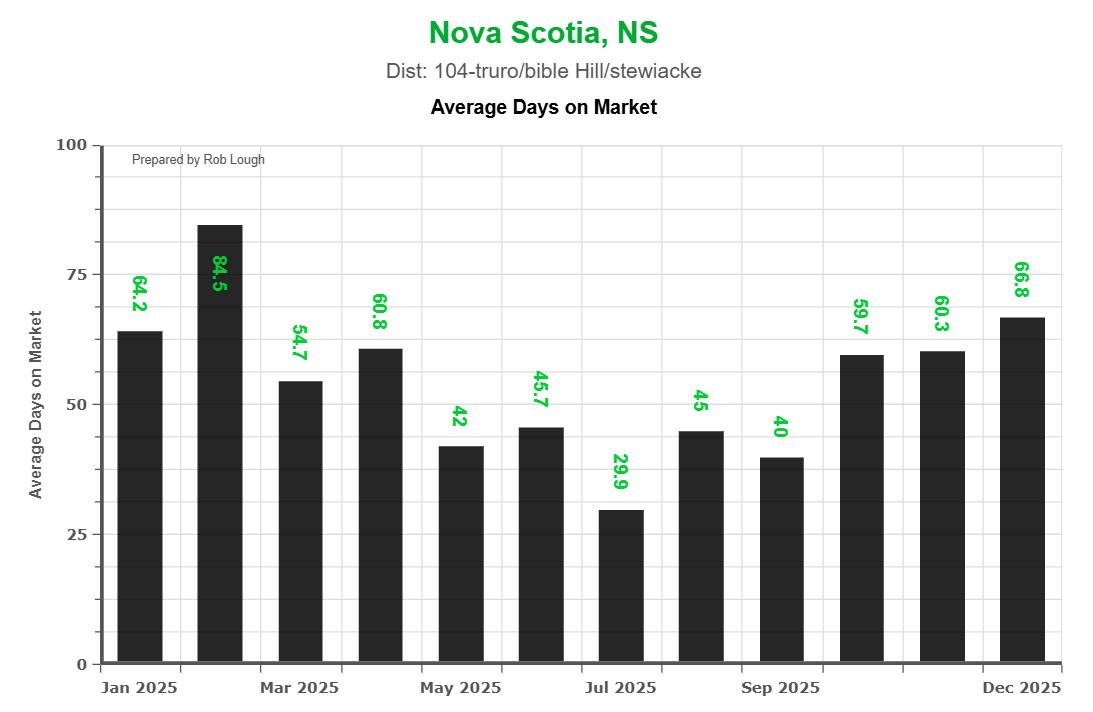
How quickly homes sell tells its own story about market dynamics. District 104 started the year at a moderate pace, with properties averaging 64.2 days on market in January. That timeline stretched to 84.5 days in February, reflecting the deep winter slowdown.
As spring arrived, momentum built dramatically. By July, the average days on market had plummeted to just 29.9 days—essentially one month from listing to accepted offer. This mid-summer low point indicates genuine competitive pressure, where buyers needed to act quickly or risk losing out.
The metric climbed back into the 60-day range as fall progressed, settling at 66.8 days in December. This ebb and flow creates very different experiences for buyers and sellers depending on when they enter the market.
For Sellers: The July low point of under 30 days demonstrates what happens when demand outstrips supply. Homes listed during the peak summer months need to be show-ready from day one. There's little room for "testing the market" or hoping to negotiate repairs after inspection—buyers are moving too fast.
For Buyers: The winter market's longer days on market translate to opportunity. Sellers who list in December or January typically have strong reasons to move—job relocation, financial pressure, or life circumstances that don't wait for spring. These motivated sellers may be more flexible on price, closing dates, and contingencies.
The contrast between 30 days in summer and 60+ days in winter also affects your offer strategy. Understanding these seasonal patterns helps you calibrate your approach to match current market realities.
Sold-to-Ask Ratio: A Market of Realistic Expectations
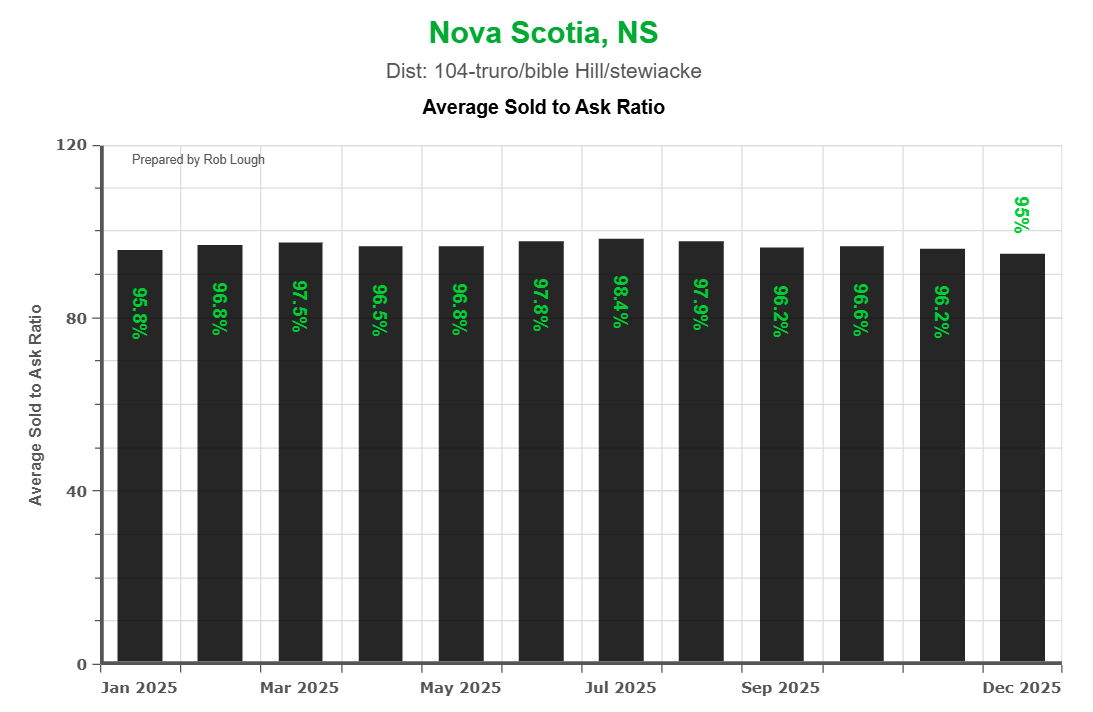
Perhaps no metric better illustrates District 104's balanced nature than the sold-to-ask ratio, which remained impressively consistent throughout 2025. Every single month, this ratio stayed between 96% and 98%, with the annual pattern showing only minor fluctuations.
January opened at 95.8%, and by December the ratio stood at 98%. This tight clustering around 97% tells a clear story: this is not a market where buyers routinely make lowball offers, nor is it one where bidding wars consistently push prices above list.
Instead, the data reflects a mature market where sellers generally price properties appropriately and buyers come prepared to pay near asking price for homes that meet their needs. This dynamic creates more predictable transactions for everyone involved.
For Sellers: These ratios validate the importance of accurate pricing from day one. Unlike some markets where sellers list high and negotiate down, District 104 buyers expect realistic pricing. Homes priced at or slightly below market value typically receive offers within a few percentage points of list.
Overpricing in this market is particularly risky. The data shows that buyers aren't making offers 10-15% below asking as a matter of course. If your home is overpriced, it's more likely to sit unsold than to receive an offer you can negotiate from.
For Buyers: The consistency of this ratio means you should be prepared to offer competitively, especially during the stronger months. Hoping to negotiate a property down from $350,000 to $320,000 runs counter to how this market actually functions. More realistic negotiations might involve getting $5,000-$10,000 off list in exchange for a quick close or waiving minor conditions.
The sold-to-ask data also provides confidence. When you see a home listed at $375,000, you can reasonably expect it will trade somewhere between $360,000 and $375,000, allowing you to budget and plan accordingly.
What District 104's ROI Means for Homeowners
The approximately 3.7% annual return on investment for 2025 positions District 104 as a wealth-building tool rather than a speculative play. This isn't the double-digit appreciation that characterized some markets during pandemic-era extremes, but it's healthy, sustainable growth that compounds over time.
For a homeowner who purchased at the average January price of $340,000, the year-end appreciation to approximately $353,000 represents about $13,000 in equity growth—and that's before accounting for any principal paydown through mortgage payments. Over a typical five-year hold period, this kind of steady appreciation can build substantial wealth.
The stability of this ROI also matters. Markets that surge 15-20% in a year often face corrections the following year. District 104's measured growth suggests a market supported by fundamentals—employment, population growth, and genuine housing demand—rather than speculation or unsustainable lending practices.
For investors, the Truro area's combination of modest appreciation and strong rental demand (driven by the NSCC's Truro campus and regional healthcare facilities) creates a compelling case for buy-and-hold strategies. The predictable seasonal patterns also allow savvy investors to time their purchases for maximum value.
Seasonal Strategy: Timing Your Move in District 104
The 2025 data makes clear that when you buy or sell in District 104 significantly impacts your experience and outcomes. Understanding these patterns allows you to play to your strengths and compensate for market weaknesses.
The Prime Selling Window: May to September
This five-month stretch consistently delivered the best combination of factors for sellers:
- Highest transaction volume (60+ homes per month)
- Shortest days on market (dipping to 30 days in July)
- Strong sold-to-ask ratios (maintaining 96-98%)
- Premium pricing (peaking near $400,000 in October)
Sellers who can target a May 1 - June 15 listing date capture buyers who have been searching through spring and are motivated to secure a home before the school year ends. The competition among buyers during this window typically means fewer price negotiations, quicker sales, and more favorable terms.
The Value Hunting Season: November to March
Buyers who prioritize getting the best possible price over immediate possession should consider this quieter period:
- Lower competition (just 27-42 transactions per month)
- Longer days on market (60-85 days)
- More negotiating leverage with motivated sellers
- Entry-level pricing opportunities (like April's $316,000 average)
The winter market also favors buyers who can accommodate flexible closing dates or who don't need the home to be perfectly move-in-ready. Sellers listing in December or January are typically doing so out of necessity rather than choice, creating opportunities for buyers willing to offer certainty and quick closes.
The Balanced Shoulder Seasons: April and October
These transitional months offer interesting opportunities for both sides. April sees the market waking up, with sellers testing the waters but not yet facing peak competition. October catches the tail end of strong fall demand before the winter slowdown.
Buyers in these months may find sellers who are calibrating their expectations after a few weeks on market, while sellers benefit from reduced competition compared to the peak summer months.
Comparing District 104 to the Broader Halifax Market
While this report focuses on the Truro area, it's worth noting how District 104's 2025 performance compared to the Halifax Regional Municipality and other Nova Scotia markets.
Halifax-area pricing saw more dramatic swings throughout 2025, with certain neighborhoods experiencing rapid appreciation followed by modest corrections. District 104's steadier path offered less excitement but also less risk—a trade-off many buyers and sellers appreciated.
The Truro area's relative affordability compared to Halifax continues to attract buyers priced out of the capital region. With HRM average prices consistently running $150,000-$200,000 higher, the combination of lower costs, reasonable commuting distance (about an hour to downtown Halifax), and quality of life in the Truro area creates sustained demand.
For those seeking smaller-market insights, check out our comprehensive Nova Scotia market coverage for comparisons with Cape Breton, the South Shore, and the Annapolis Valley.
What the Data Means for 2026
As we move into 2026, several factors suggest District 104 will maintain its stable trajectory:
Positive Indicators:
- Continued federal mortgage rule changes improving buyer accessibility
- Strong local employment from Truro's healthcare sector and Debert's industrial park
- Ongoing Halifax spillover demand as buyers seek affordability
- Limited new construction maintaining inventory tightness during peak months
Potential Headwinds:
- Interest rate uncertainty affecting buyer qualification
- Economic softness impacting consumer confidence
- The natural completion of the multi-year post-pandemic adjustment period
The combination suggests another year of modest appreciation is likely, probably in the 3-5% range, with the same seasonal patterns dominating transaction timing and volume.
Takeaways for Buyers and Sellers
Sellers in District 104 should:
- Target May through September for maximum competition and premium pricing
- Price accurately from day one—the 96-98% sold-to-ask ratio rewards realism
- Ensure homes are show-ready if listing during peak months where 30-day sales are normal
- Consider the slower winter months only if motivated by circumstances requiring a quick sale
- Work with agents who understand hyper-local pricing—even $10,000 overpriced can mean weeks of additional market time
Buyers in District 104 should:
- Plan winter and early spring searches to maximize negotiating leverage
- Come prepared to act quickly during summer months when inventory turns in 30 days
- Offer competitively—expecting 10-15% off list is unrealistic given sold-to-ask data
- Factor the commute to Halifax into your affordability calculations if working in HRM
- Get pre-approved before shopping to act quickly when you find the right property
Why District 104 Remains a Smart Investment
The Truro, Bible Hill, and Stewiacke corridor offers something increasingly rare in Nova Scotia real estate: predictability. While no market is without risk, the 2025 data demonstrates a mature, balanced market where fundamentals—not speculation—drive pricing.
The 3.7% ROI won't make headlines, but it will build wealth steadily over time. The seasonal patterns won't change dramatically year over year, allowing thoughtful planning. The consistent sold-to-ask ratios won't create viral stories about bidding wars or lowball offers, but they will facilitate thousands of smooth transactions.
For buyers priced out of Halifax, families seeking smaller-city lifestyle, or investors building portfolios, District 104 deserves serious consideration. The combination of affordability, appreciation, and accessibility to broader Nova Scotia employment centers creates sustained, balanced demand.
Working with Local Expertise
Understanding these market dynamics is valuable, but navigating them successfully requires local knowledge that extends beyond the statistics. Truro-area real estate encompasses everything from heritage properties in downtown Bible Hill to rural acreages in Stewiacke to new construction on Truro's growing edges.
Each micro-market within District 104 has its own characteristics, buyer profiles, and pricing dynamics. The difference between a property on Walker Street and one on Young Street might be $50,000—or it might be $5,000, depending on recent comparables, condition, and timing.
At Century 21 Optimum Realty, we've tracked these patterns across decades of transactions. Whether you're a first-time buyer trying to time your entry or a seller wondering whether to list now or wait until spring, we provide the local insight that turns market data into actionable strategy.
Related Resources
For Buyers:
- First-Time Home Buyer Programs in Nova Scotia
- Mortgage Pre-Approval: What You Need to Know
- Understanding Nova Scotia Property Taxes
For Sellers:
- Preparing Your Home for Sale in Rural Nova Scotia
- Understanding Market Value vs. Assessed Value
- Seasonal Home Maintenance Checklist
Market Analysis:
- Halifax Real Estate Market Trends
- Nova Scotia Housing Market Overview
- Rural Nova Scotia Property Guide
Rob Lough is a Broker/Owner and Realtor® at Century 21 Optimum Realty, serving the Truro, Bible Hill, Stewiacke, and surrounding areas of Nova Scotia. With two decades of experience and deep roots in central Nova Scotia, Rob provides buyers and sellers with the local expertise needed to navigate District 104's unique real estate landscape. Contact Rob at www.roblough.com to discuss your real estate goals.